| MAURITIUS |
| BLACK RIVER |
| - Weak Tropical Storm |
67,471 |
100.0% |
| - Strong Tropical Storm |
67,471 |
100.0% |
| - Category 1 (74-95mph) |
67,471 |
100.0% |
| - Category 2 (95-110mph) |
2,301 |
3.4% |
| FLACQ |
| - Weak Tropical Storm |
139,348 |
100.0% |
| - Strong Tropical Storm |
139,348 |
100.0% |
| - Category 1 (74-95mph) |
139,348 |
100.0% |
| GRAND PORT |
| - Weak Tropical Storm |
118,023 |
100.0% |
| - Strong Tropical Storm |
118,023 |
100.0% |
| - Category 1 (74-95mph) |
118,023 |
100.0% |
| - Category 2 (95-110mph) |
11,892 |
10.1% |
| MOKA |
| - Weak Tropical Storm |
84,053 |
100.0% |
| - Strong Tropical Storm |
84,053 |
100.0% |
| - Category 1 (74-95mph) |
84,053 |
100.0% |
| PAMPLEMOUSSES |
| - Weak Tropical Storm |
136,140 |
100.0% |
| - Strong Tropical Storm |
136,140 |
100.0% |
| - Category 1 (74-95mph) |
136,140 |
100.0% |
| PLAINES WILHEMS |
| - Weak Tropical Storm |
398,875 |
100.0% |
| - Strong Tropical Storm |
398,875 |
100.0% |
| - Category 1 (74-95mph) |
398,875 |
100.0% |
| PORT LOUIS |
| - Weak Tropical Storm |
142,382 |
100.0% |
| - Strong Tropical Storm |
142,382 |
100.0% |
| - Category 1 (74-95mph) |
142,382 |
100.0% |
| RIVIERE DU REMPART |
| - Weak Tropical Storm |
110,081 |
100.0% |
| - Strong Tropical Storm |
110,081 |
100.0% |
| - Category 1 (74-95mph) |
110,081 |
100.0% |
| RODRIGUES |
| - Weak Tropical Storm |
39,590 |
100.0% |
| - Strong Tropical Storm |
39,590 |
100.0% |
| SAVANNE |
| - Weak Tropical Storm |
73,892 |
100.0% |
| - Strong Tropical Storm |
73,892 |
100.0% |
| - Category 1 (74-95mph) |
73,892 |
100.0% |
| - Category 2 (95-110mph) |
43,485 |
58.8% |
|


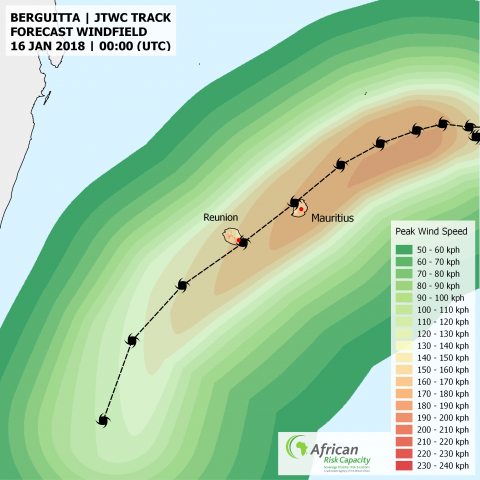
 The following map shows the forecast peak surge depth at the time of reporting:
 NB: It is important to note that these maps are based on forecasts, which will be updated as soon as the next update on the cyclone track is released.
[/tab]
[tab]
NB: It is important to note that these maps are based on forecasts, which will be updated as soon as the next update on the cyclone track is released.
[/tab]
[tab]