[box type="shadow" class="" width="" background=#000000]The African Risk Capacity monitors tropical cyclone activity in the South-West Indian Ocean (SWIO) and relies on Africa RiskView, a disaster risk modelling platform that uses satellite-based and other geo-information to forecast wind speed and storm surge height and estimate population affected and economic loss. These modelled losses are the underlying basis of the insurance policies issued by the ARC Insurance Company Limited, the financial affiliate of the ARC Agency, which pools risk across the continent.[/box]
| Name |
Event Number |
Naming Date |
Last report as a cyclone |
Countries affected |
| ENAWO |
09 |
03/03/2017 |
11/03/2017 |
Madagascar |
[tabs type="horizontal"]
[tabs_head]
[tab_title]
Windfields & Surge Depth [/tab_title]
[tab_title]
Population Affected [/tab_title]
[/tabs_head]
[tab]
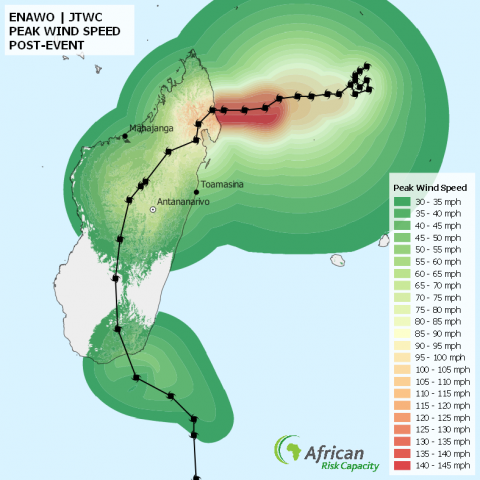
The following map shows the wind fields of the tropical cyclone. Note that wind speeds are only recorded if the storm was classified as tropical cyclone (peak wind speed over 35 kts)..
 The following map shows the storm surge depth of the tropical cyclone. Note that surge are only recorded if the storm was classified as tropical cyclone (peak wind speed over 35 kts)..

[/tab]
[tab]
Based on windspeed and surge depth, Africa RiskView calculates the potential number of people affected by the tropical cyclone. The table below shows the number of people affected (by different categories of wind speed).
| Location / Category |
Population affected |
| MADAGASCAR |
| ANTANANARIVO |
| Category 1 (74-95mph) |
161359 |
2.5% |
| ANTSIRANANA |
| Category 1 (74-95mph) |
827392 |
49.9% |
| Category 2 (95-110mph) |
510834 |
30.8% |
| Category 3 (111-129mph) |
187724 |
11.3% |
| Category 4 (130-156mph) |
7243 |
0.4% |
| MAHAJANGA |
| Category 1 (74-95mph) |
591958 |
24.4% |
| Category 2 (95-110mph) |
159281 |
6.6% |
| Category 3 (111-129mph) |
17720 |
0.7% |
| TOAMASINA |
| Category 1 (74-95mph) |
642351 |
17.7% |
| Category 2 (95-110mph) |
178395 |
4.9% |
| Category 3 (111-129mph) |
57023 |
1.6% |
|
[/tab]
[/tabs]


 The following map shows the storm surge depth of the tropical cyclone. Note that surge are only recorded if the storm was classified as tropical cyclone (peak wind speed over 35 kts)..
 [/tab]
[tab]
[/tab]
[tab]